
Most people recognize Milgram by his research on the obedience. This review attempts to highlight Milgram research on topics except small-world and obedience experiments. The review is based on the book “The man who shocked the world” by Thomas Blass.
conformity
Followed by the work of his advisor Asch on Conformity, Milgram conducted social conformity setting in another setting in Norway. The subjects were asked to answer some questions where they were told that there are other subjects in the experiments (bogus).

Illustration 1: level of conformity in each sets of experiments. The blue color shows Norwegian subjects and the gray color shows French subjects.
The subjects, follow bogus majority about 62% of the time. However, if the answer have serious consequences, the conformity dropped to 50 % (aircraft condition). In private condition, where subjects write down the answer instead of announcing it, the level of conformity was 50 %. In bell condition, the subjects could ring bell and ask for repetition of the words. That leads to 69% conformity. In Censure condition, the confederates, gave contradicted opinion right after the subject respond and that jumped the conformity to 75%. Milgram repeated the experiment with Norwegian from different social classes and there was no statistically significant differences. Milgram repeated the experiment in France. What he discovered is that social conformity in general was lower among Parisian than Norwegians.
In another example, Milgram showed that people can behave differently within a group than as an individuals. The subjects increased the level of shock as a learner gave incorrect answer (like in obedience setting). However, the subjects either act in group – where the other two confederates called for on-step shock increase each time the learner made mistake – or they act individually.

Illustration 2: The subjects increase the level of shock as a result of being in group pressure.
lost letter
Milgram not only examined six degree of separation, but he also experimented the diversification of the subject of the targeted letter and the subject who send the mail. The technique also used to predict elections in one county. More letter had been mailed from either party, could determine what party people are voting for. In terms of ethnicity, they also found differences between black and white subjects. His research on distributing letters addressed to pro-Peking and pro-Taiwan, was unfinished.
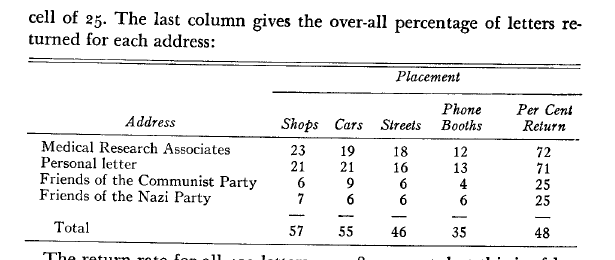
Illustration 3: results of lost-letter technique. Depends on the location of the letter and the address, the number of letters that had been returned varied.
City psychology
Help stranger – Milgram conducted various experiments to explain behavioural differences between urban and rural residents. He introduced an idea of overload – in which a system holds more input than it can be understood. In such experiments, he addressed the readiness to help stranger. People went house to house and asked if they can use the telephone for emergency calling. What he found was that people in cities were less helpful than the small town residents.
In another experiments, with his students, they conducted series of experiments in the New York subways. The students asked the passengers to give their seats to them. They wanted to know in what extend people are willing to give their seat to a stranger.
Mental maps – How the objective geographical layout of a city was represented subjectively in the minds of its residents. He explained “… people make many important decisions based on their conception of a city, rather than the reality of it. …”. E.g. the Parisians were asked to draw the map of Paris. Milgram recognized certain order of entering a place in the map. That Shows the importance and the history of the city. The mental map of the city show how the city sits in the mind of its residence.
Vertical city versus flat city – How does living in skyscraper modify thinking and behavior? What effect does the vertical life have on human relationship?
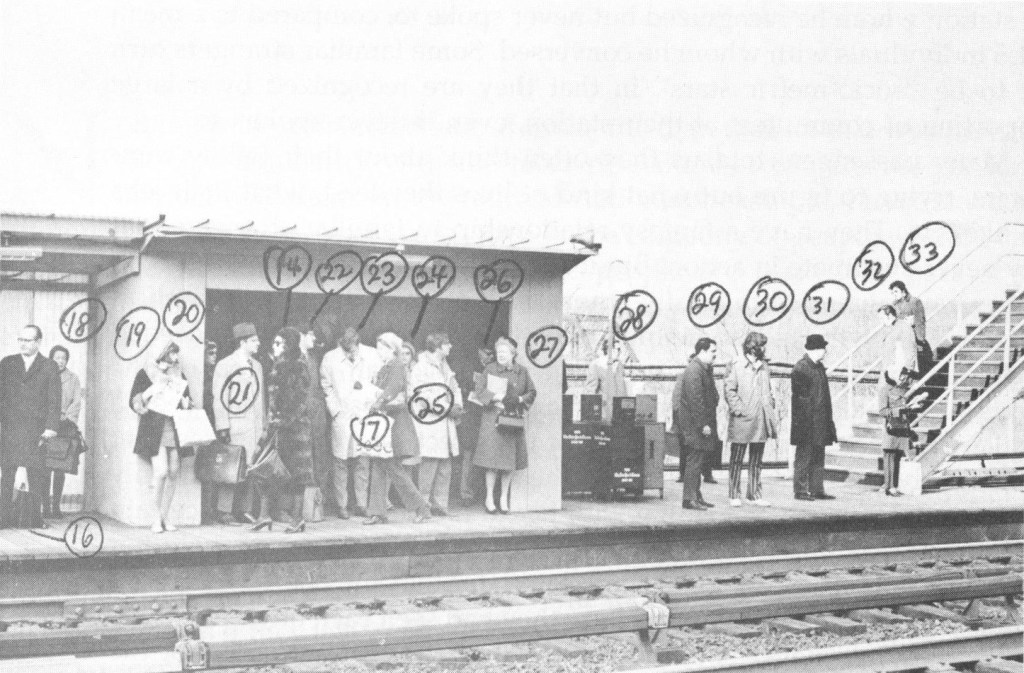
Familiar stranger – The students gave a photo of crowds standing in the subway to the passengers and ask the subjects to recognize the people in the photo. 89% of the people recognized at least one familiar stranger. On average, they reported seeing 4 familiar stranger. 47% of people were curious about the familiar stranger.

Illustration 5: The familiar stranger experiments. The people in the experiments were asked to name which passengers they can recognize from the photo.
“… in order to handle all the possible inputs from the environment, we filter out inputs so that we allow only diluted form of interaction. In the case of familiar stranger, we permit a person to impinge on us but close off any further interactions. In part this is because perceptual processing of a person takes less time than social processing. We can see a person at a glance but it takes more time to sustain a social involvement.”
Power of crowds
Milgram designed an experiments to test the social contagion. Up to 15 stimulus crowds, gathered in a busy street in New York looking up to the sky. They realized, as the number of stimulus increase from 1 to 15, more passerby gaze up to the sky.
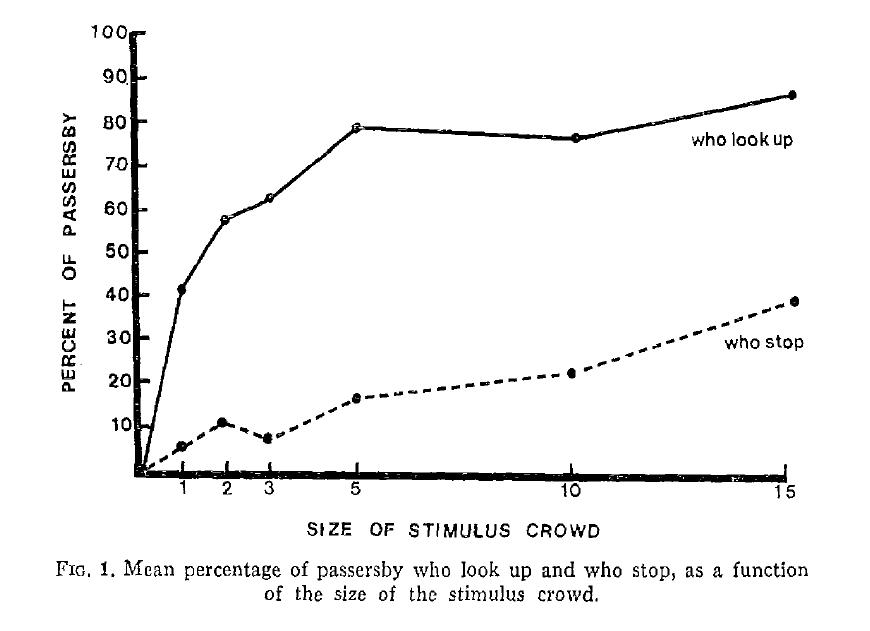
Illustration 6: Power of the crowd experiment. The size of the crowd who look up the sky increase as a function of the stimulus crowd.
Movies that were conducted by Milgram
Nonverbal communication
The city and the self
Conformity and independence
Human aggression
Invitation to social psychology


Leave a comment